Reflecting on my own learning and development
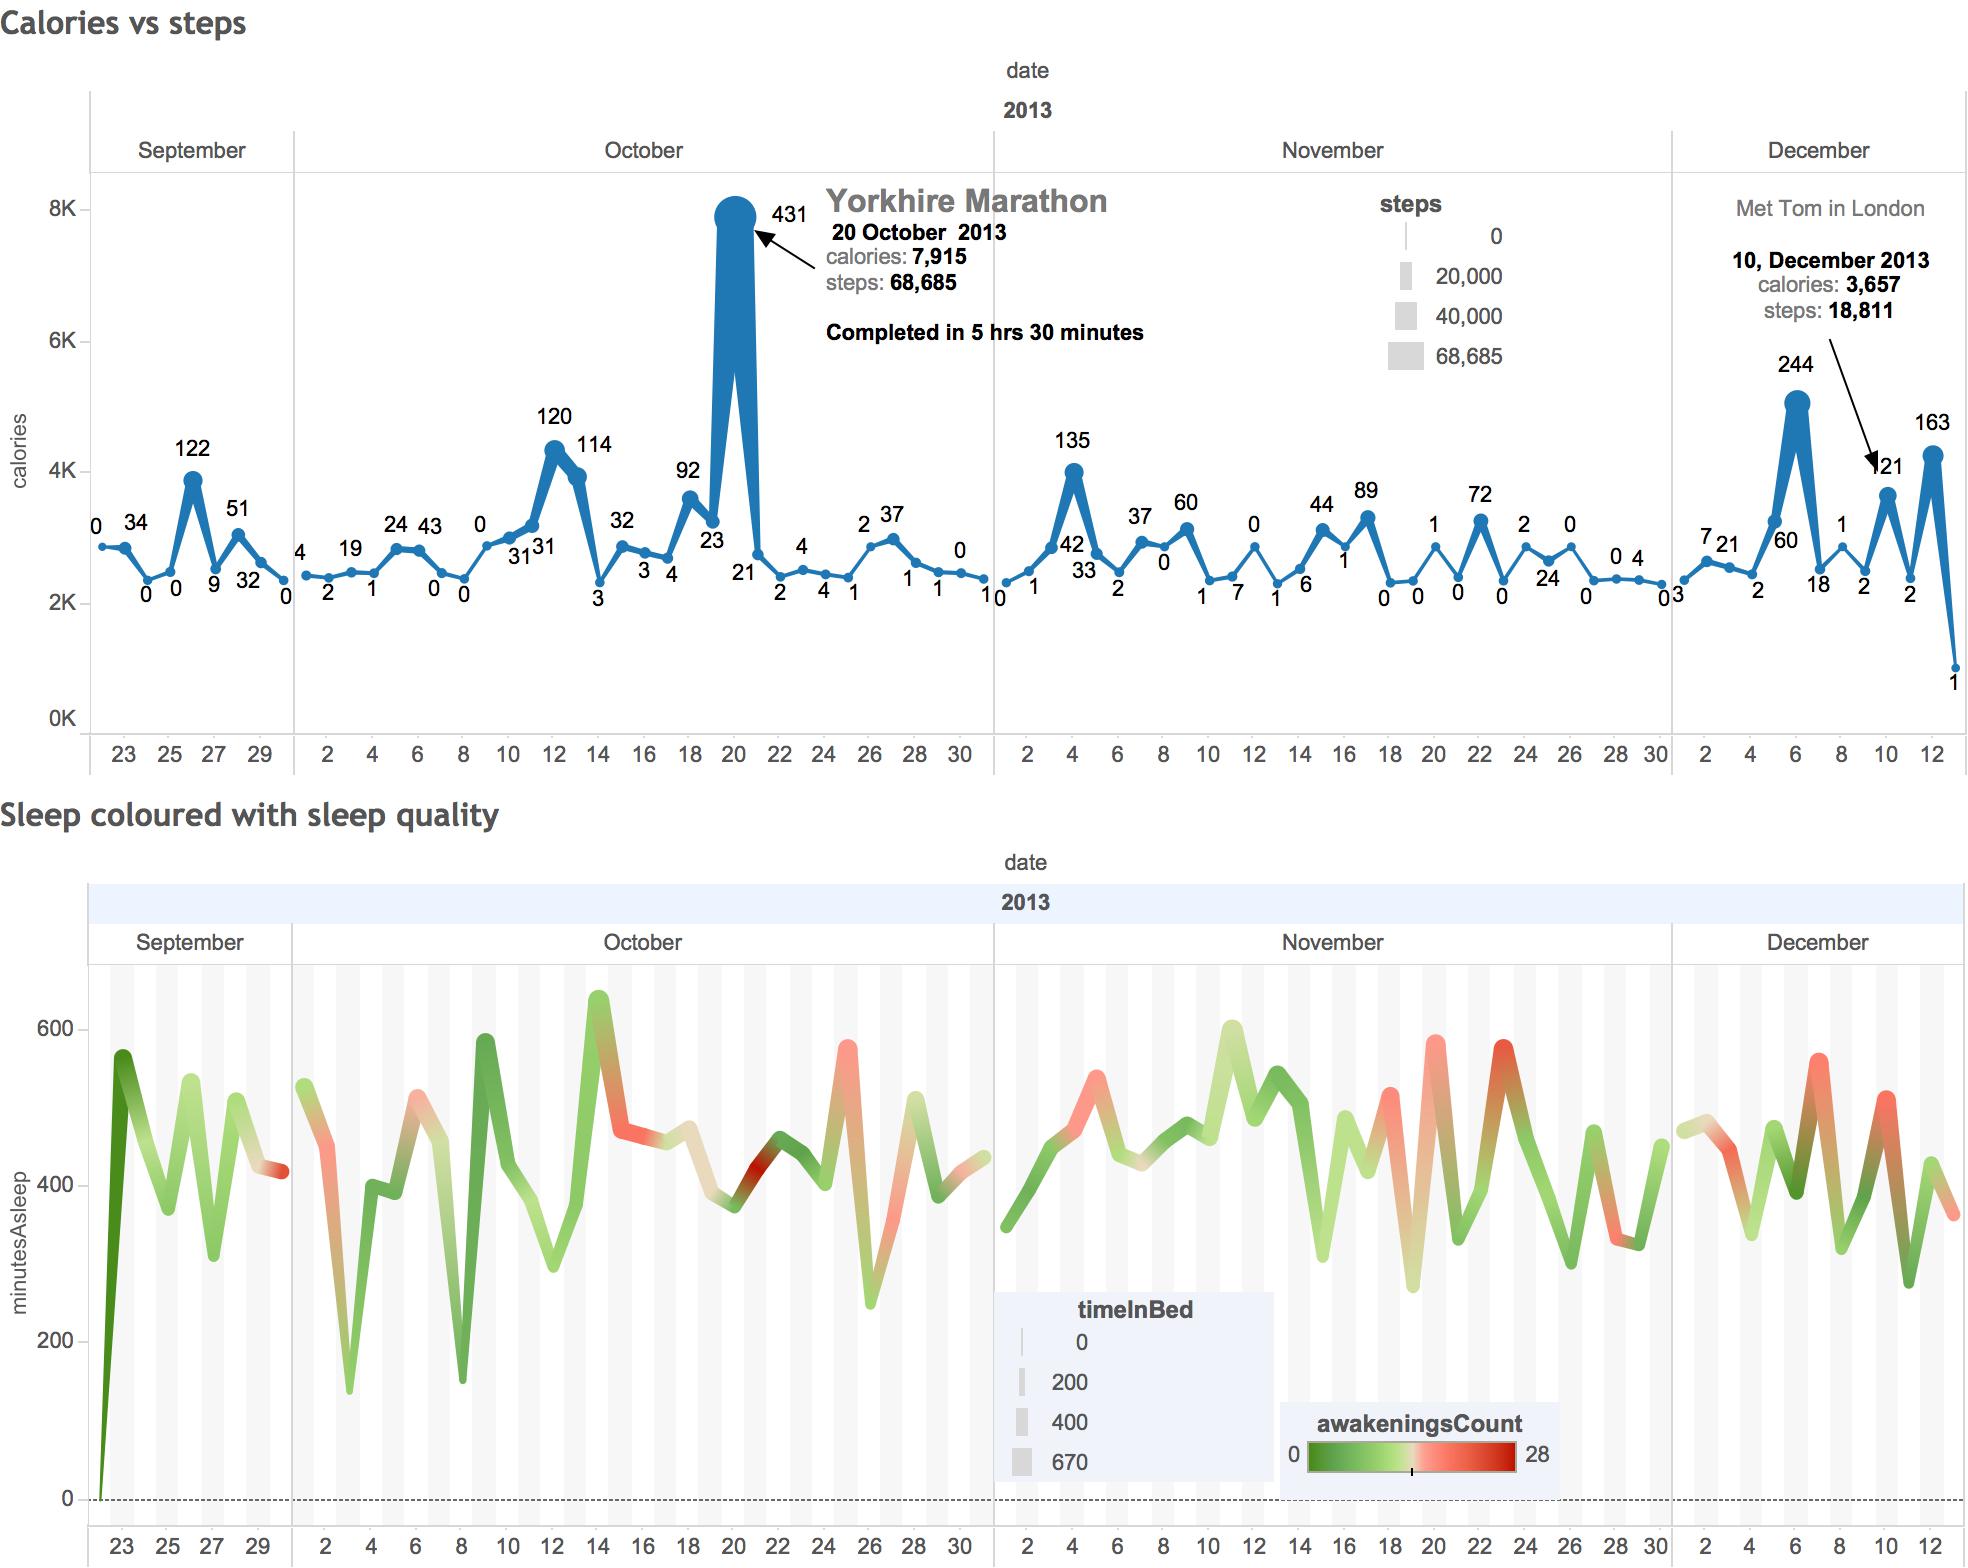
Since my return to the team at The Information Lab, it’s been great to see the growth of The Data School. It prompted me to re-evaluate my own learning experience of Tableau. I started out with no experience, here’s my first attempts at visualisation, I produced this almost 4 years ago ahead of a meet and greet with The Information Lab.
 A viz on earthquakes
 My first attempts at quantified self visulisations
It’s great looking back at this work and seeing very clearly what I understood, misunderstood and also just hadn’t thought about and it got me thinking about what I would have changed about my experience of learning Tableau. There are many blogs on this topic, some technical others about the experience and the community. However I’d like to present an alternative perspective and that is that learning Tableau and discovering Tableau are two distinct activities and both should be given equal importance. It’s easy to confuse or merge those concepts into one general learning approach when infact they each deserve their own distinct airtime and I believe that those who’ve invested time in both techniques build strong visualisations that engage their audience even though their foundational learning is still in progress (it never stops), let me elaborate.
Learning vs discovery
First I’ll tackle what I believe I mean by the typically learning approach. Good examples include working through the learning pages on the Tableau website, signing up for webinars, working through exercises or attending classes free or paid. This kind of progress might then have milestones such as certification or accreditation. The foundation topics you would cover would actually infact be applicable to most if not all business intelligence tools with a few quirks or differences.
So how is all that different from discovery? Well the issue with structured methods as I’ve described is the structure, whilst it’s great at making sure you reach certain standards and milestones, it cannot possibly reflect the diversity of what’s possible with the tool or the creativity of the community. In order to understand the more abstract ways in which you can use Tableau you need to step back from the technical and step into the creative mindset and in order to fuel the creativity you need to have a discovery led approach to your learning.
Key elements of discovery learning
Whilst I use the term loosely in the blog, discovery learning is a formal process of learning.Amongst its strengths is it’s organic way of developing problem solving skills and creativity, at the same time. Because we all discover content in different ways, it’s also a more tailored approach allowing you to build your skills in the format and way that best suits your learning style. Yes it requires a level of autonomy, a word that sends shudders down the backs of anyone who has to manage an IT infrastructure, but I see this as a benefit, as the rapid self service style of Tableau, promotes the autonomous culture amongst decision makers in business. Those who enjoy this autonomy consider it liberating and we often find it allows us to be creative in our approach to deliver work we’re passionate about.
My favourite examples of discovery learning in action
1: Technical Weekly Challenges.
Whether its Makeover Monday, or any of the other weekly challenge, an internal team challenge or a question in a forum, setting yourself challenges to try and build things outside of your usual realm and comfort zone is a fantastic way to discover new techniques. Better yet once you figure it out, teach another person. The key thing here is technique and being able to walk another individual through it. Seeing tools being used in un-anticipated ways or simply recreating a visualisation you’ve seen before is a great natural way to build a good understanding about the ideas and concepts right at the edge of possibility. It’s also a natural place to learn to interact with the community and culture around Tableau.
2: User groups.
Set one of these up at your work place or if you’re the only warrior of change then visit one of the wider Tableau user groups. There’s nothing worse than spending time and effort trying to solve problems and find answers to issues which are being solved by the community at large. It’s also a great way to bring champions together and give them a space to showcase their own discoveries multiplying your own understanding.
3: Cross industry context.
Step outside the bubble. Yes I said it, we Tableau folk can sometimes spend too much time just talking to each other. Yet many of the changes we see Tableau and our organisations going through have already been overcome in other sectors further along the journey of transformation. My current guilty pleasure is the world of augmented reality and the user interfaces being designed for them and how this might apply to data visualisation in the future. There’s also this great example of user experience design over at Netflix….
 Promoting the idea of prototyping in engineering teams by Rachel Binx
4: Blogs
This sounds obvious but it’s quite hard to keep up with all the posts across the net. Invest some time in an RSS feed reader like Feedly, crowdsource some blogs from the community or start of by curating the blogs of the Tableau Zen Masters and build it out from there. Set aside 30 minutes a week to read a few posts and glance over many more. The blogs shouldn’t be all from the Tableau world either, broaden out. As a helping hand here’s list of the blogs in my RSS feed.
To conclude, discovery doesn’t stop after the first few weeks with Tableau, whether you’re a beginner, advanced user or Jedi, discovery is one of the most important factors to your continued development keeping you curios and organically allowing you to build your skills beyond the requirements we see in day to day business.